Portofolio 2
Posted on: May 18, 2008
Tugas 3
Menggunakan fungsi opening dan closing
Foto asli:
% membuka image
im = imread (‘polka.jpg’);
imshow (im)

% mengubah image ke bentuk grayscale
grayscale = rgb2gray(im);

% mengubah image ke bentuk biner
biner = im2bw(grayscale,0.5);

% operasi closing
se = strel(‘disk’,3);
IMC = imclose(biner,se);
imshow(IMC), title(‘Closing’)

% operasi opening
IMO = imopen(biner,se);
imshow(IMO), title(‘Opening’)

% operasi open-close untuk menghilangkan noise
openclose = imclose(IMO,se);
imshow(openclose), title (‘open-close’)

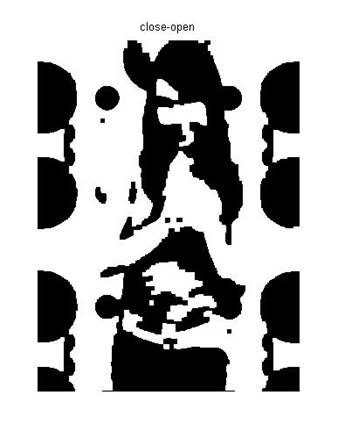
% operasi close-open
closeopen = imopen (IMC,se);
imshow(closeopen), title (‘close-open’)
Tugas 4
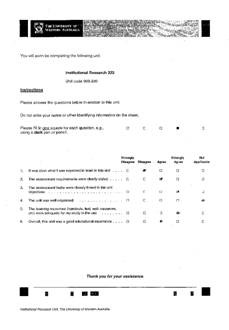
Menentukan lokasi empat kotak di pojok form menggunakan program locatemarks.m
Image ’surf01.png’

Outputnya

Image ’surf02.png’
Outputnya

Image ’surf05.png’

Outputnya

Listing program locatemarks.m
% LOCATELANDMARKS – locates landmarks on SURF form
%
% Usage: [tl, tr, bl, br] = locatelandmarks(im)
%
% Argument: im – citra biner
%
% Returns: tl, tr, bl, br
% – Koordinat titik pusat dari landmarks di kiri-atas
% (top-left),kanan-atas (top-right), kiri-bawah
% (bottom-left), dan kanan-bawah (bottom-right).
% Koordinat ini berbentuk vektor kolom [row; col]
% untuk setiap landmark.
%
% Fungsi ini juga menampilkan image dengan titik pusat (centroids)
% dari landmarks overlayed.
function [tl, tr, bl, br] = locatelandmarks(im)
% membaca input image
gambar = imread(im)
[rows,cols] = size(gambar);
% koordinat landmarks
tl=[rows;cols];
tr=[rows;0 ];
bl=[0 ;cols];
br=[0 ;0 ];
% citra biner dengan background hitam dan objek putih
bw = ~gambar;
% faktor skala
a = 8/800;
SE = ones(a*rows, a*cols);
% operasi close-open
closeopen = imopen(imclose(bw,SE),SE);
x = ones(rows,1)*[1:cols];
y = [1:rows]’*ones(1,cols);
% bwlabel untuk menandai setiap blob dan menghasilkan jumlah blob
[L, num] = bwlabel(closeopen);
% mencari blob untuk centroid
for i = 1:num
img = L==i;
area(i) = sum(sum(img));
meanx = sum(sum(double(img).*x))/area(i);
meany = sum(sum(double(img).*y))/area(i);
% koordinat top-left
if tl(1)+tl(2) > meanx + meany
tl = [meanx; meany];
tlindex = i;
end
% koordinat top-right
if tr(1)-tr(2) > meanx – meany
tr = [meanx; meany];
trindex = i;
end
% koordinat bottom-left
if bl(1)-bl(2) < meanx – meany
bl = [meanx; meany];
blindex = i;
end
% koordinat bottom-right
if br(1)+br(2) < meanx + meany
br = [meanx; meany];
brindex = i;
end
end
imshow(gambar)
hold;
landmarks = [tl, tr, br, bl];
plot(landmarks(1,:), landmarks(2,:),’xr’,’MarkerSize’,12,’LineWidth’,1);
plot(landmarks(1,:), landmarks(2,:),’+r’,’MarkerSize’,12,’LineWidth’,1);
hold;
end

Leave a comment